The December 10, 2025 FOMC decision looked mild on the surface—a widely expected 25bp cut to the federal funds rate, bringing it to 3.50%-3.75%. But beneath that veneer lay a carefully orchestrated hawkish surprise. The real flashpoint was the signal from the meeting minutes and the latest Summary of Economic Projections (SEP): the Fed's assessment of the "neutral rate" has shifted qualitatively, and internal dissent over the pace of cuts has reached a peak not seen in years. The vote saw an extremely rare three dissents—Governor Miran aggressively pushed for a 50bp cut, while Chicago Fed President Goolsbee and Kansas City Fed President Schmid stood at the other extreme, arguing to hold rates steady. This intense internal battle directly implies that the path ahead for rate cuts will be anything but smooth.
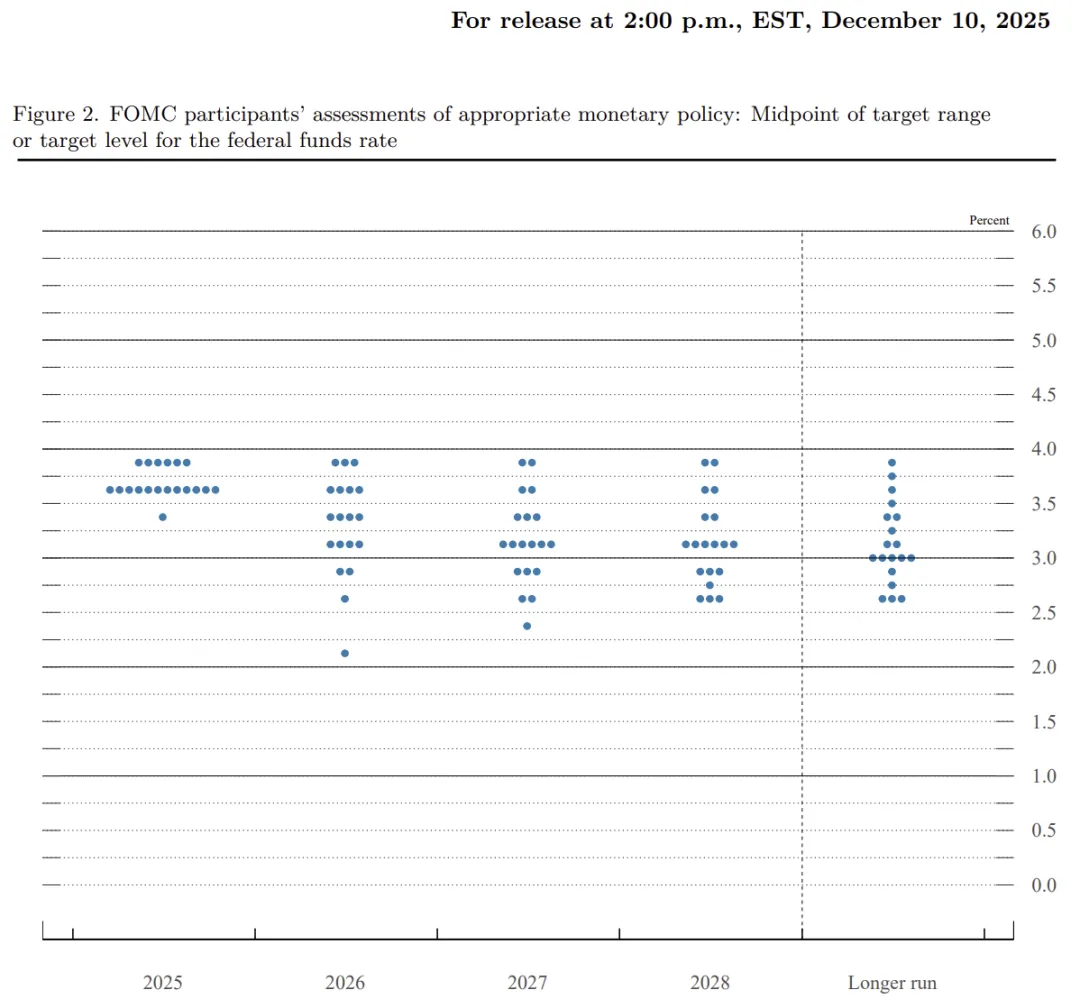
In the September dot plot, the committee had hinted at ample room for future cuts. But in December, that expectation was dramatically revised. The latest dot plot shows the median projection for the federal funds rate at end-2026 is 3.4% (3.25%-3.50% range). This implies only one 25bp cut for the entire year of 2026.
This sharp revision stems from two diverging data points:
-
Sticky inflation: The SEP shows the median projection for core PCE inflation in 2025 remains at 3.0%, and the 2026 forecast holds at 2.6%, well above the 2% target.
-
A slowing labor market: The unemployment rate forecast was revised up to 4.5%.
This complex mix of "sticky inflation + slowing economy" forced Powell and the committee to emphasize in the statement that "uncertainty remains elevated" and to delete previous language about slowing job growth, replacing it with a note that "downside risks have increased in recent months."
Market Pricing Reverses Sharply: From "Comfortable Cuts" to "Holding Steady"
The market's reaction to the Fed's hawkish pivot was swift and violent. According to the latest CME FedWatch Tool, traders are frantically revising their 2026 expectations.
The most immediate impact is visible in bets on the next meeting (January 28, 2026). Data shows the probability of holding rates at 3.50%-3.75% stands at 80.1%, while the chance of another 25bp cut is just 19.9%. This effectively means the market has accepted Powell's hint of a "pause," making January likely an "observation period."
The longer-term picture is even more pessimistic. Looking at the CME data chain, even by the June 17, 2026 meeting, the combined probability of rates staying above 3.25% (i.e., at most one cut or none) remains dominant. This aligns closely with the FOMC dot plot's "only one cut in 2026" signal. Traders had previously been betting on a smooth downward slope, with rates quickly returning to the comfort zone around 2.5%. But now, the median projection for the longer-run federal funds rate is pinned at 2.9%, and the 2026 rate midpoint has been forcibly lifted to around 3.4%.
Transmission Mechanism: Surging US Treasury Yields and the Hong Kong Liquidity Storm
This revision in expectations, transmitted through the core medium of US Treasury yields, has violently repriced global assets.
The 10-year US Treasury yield (US10Y) is the anchor for global asset pricing. In the 48 hours after the FOMC decision, as shown in the latest TradingView chart, US10Y staged a textbook "hawkish jump." Before the meeting, yields were hovering around 4.10%. But with the release of the dot plot and Powell's hawkish comments, yields surged, briefly breaking above 4.143% and stubbornly holding above 4.14% in subsequent sessions.
The surge in US Treasury yields dealt a double blow to the Hong Kong market:
-
Valuation denominator pressure: As an offshore market, Hong Kong's discount rate is directly influenced by US Treasury yields. When the risk-free rate holds above 4.15%, the appeal of Hong Kong's high-dividend assets (e.g., banks and utilities yielding 5%-6%) instantly diminishes. Foreign institutions, when allocating assets, realize they can earn over 4% simply by holding US Treasuries without taking on China's macroeconomic volatility. This directly triggers capital outflows.
-
Liquidity expectations dashed: Foreign capital had been betting that the Fed would aggressively ease to save the economy (as Governor Miran's 50bp cut proposal suggested), thereby pushing funds into Hong Kong via a weaker dollar. But the script has now flipped to "sticky inflation + high rates sustained," with the dollar index returning to strength. The logical foundation for capital flowing back to Hong Kong has collapsed. Especially given the SEP's forecast of US GDP growth at just 2.3% for 2026, the US economy, while resilient, is not strong enough to generate spillover effects. Capital is more inclined to return to the US to capture risk-free high yields.
Squeezed from Both Sides: Disappointing Domestic Expectations and Wavering Southbound Flows
If the Fed is the external threat, then the disappointment of domestic policy expectations is the internal worry—and the fundamental reason why Southbound capital (northbound flows) has sharply reduced its buying in recent days. Southbound funds were staunch bulls in Hong Kong during the first three quarters of 2025, driven by bets on strong domestic stimulus. However, facing the external pressure of the Fed's "dot plot" raising the rate path, the space for domestic monetary policy has been further squeezed.
Deeper data reveals a qualitative shift in the composition of Southbound buying. Previously, they heavily bought high-dividend state-owned enterprises as quasi-fixed-income assets. But with CME data showing rates staying high at 3.25%-3.75% for most of 2026, the risk-free return on dollar assets remains attractive, severely compressing the "relative value" (yield spread) of Hong Kong high-dividend stocks.
Moreover, the SEP shows the US unemployment rate is expected to stay at a relatively low 4.4% in 2026, indicating the US economy is not entering a recession. This invalidates the logic of betting on capital flows to emerging markets via a "recession trade." In this environment, mainland institutional funds have chosen to take profits and exit. Since late November, Southbound flows have been consistently net negative or barely positive. With the largest marginal buyer gone, Hong Kong stocks have naturally fallen into a negative feedback loop of shrinking volumes and persistent declines.
Summary and Outlook
In summary, this FOMC meeting effectively declared a temporary end to the "global monetary easing dividend." The dot plot's signal of only one cut in 2026, combined with the CME market's 80% probability of a January pause, has completely shattered market fantasies of a rapid return to an easing cycle. The market is shifting from "beta hunting" to "defense."
For Hong Kong stocks, the future path is painfully clear: wait until Q1 2026, either for a substantial upside surprise in Chinese economic data, or for US inflation (core PCE) to decisively break below the 2.6% forecast, forcing the Fed back to a dovish stance. Until then, under the weight of a 3.50%-3.75% benchmark rate, Hong Kong stocks will struggle to stage an independent rally.
Risk Disclaimer: This content is for informational purposes only and does not represent any investment advice. Market risk exists; invest with caution.

专注投资分析、市场洞察与资产配置。不追短期波动,只理解真正驱动长期回报的东西。